

Reading the Treasury Tea Leaves
Treasury auctions are giving early pressure readings on borrowing costs — with clues for mortgages, businesses, cities, and the cost of U.S. debt.


Every once in a while, the nerdy plumbing of Treasury markets becomes a worthwhile dinner party story.
We all know the Fed controls short-term interest rates. But if investors think the Fed is not doing enough to control inflation, they can demand higher yields before lending to the U.S. government for years or decades. One or two or even a hundred investors usually can’t move the whole Treasury market for long on their own. After all, the Treasury market, with more than $30 trillion in securities outstanding, is still considered the deepest, most liquid market in the world and perhaps the most competitive.
But around big auctions, quarter ends, tax-payment dates, or sudden shocks, investor cash can be spread more thin and those buyers (ie. investors) can become more choosy. If enough investors demand more compensation to lend to the U.S. government at the same time, borrowing costs can rise even without a Fed hike.
A few forces at odds with each other bring the drama to this tea reading. War and oil shocks can feed inflation fears, making investors ask for higher rates before lending to the U.S. government, particularly for the long-term. More borrowing from the U.S. government, cities, companies, and the AI infrastructure buildout also adds competition for long-term investors’ money, raising the rates investors can demand. At the same time, global uncertainty can increase investors’ demand for Treasuries as a safe place to park money, pushing down interest rates. Treasury auctions show which of these forces are prevailing for buyers of Treasuries, shaping interest rates for people and businesses around the world, as well as the types of business models that will thrive in the years to come.
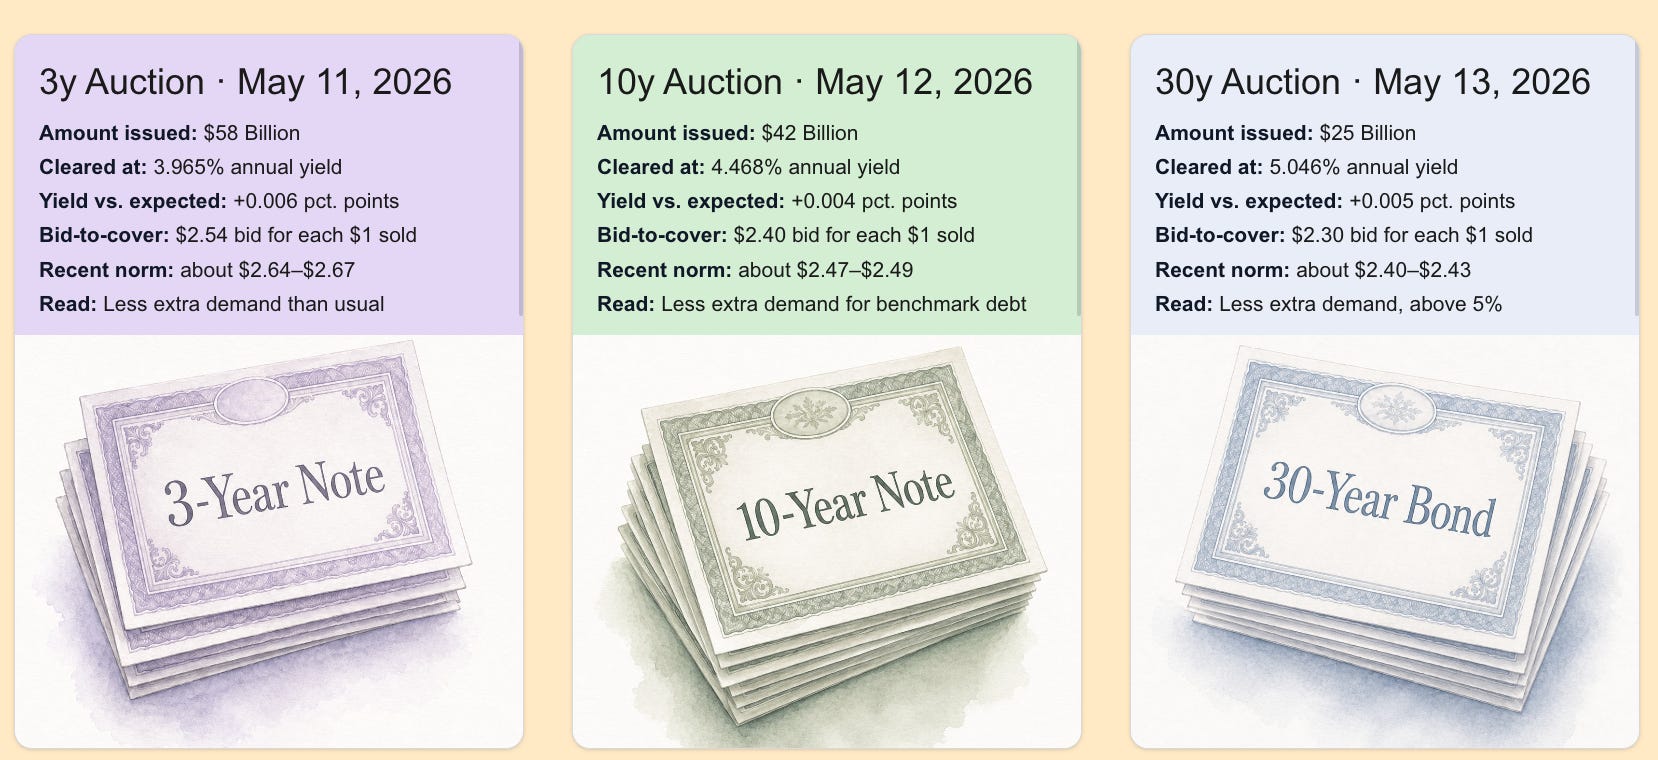
This week gives us a fresh read of the tea leaves because Treasury is selling 3-year, 10-year, and 30-year debt. The 3-year auction Tuesday will tell us more about the shorter-term Fed-sensitive part of the market. The 10-year auction Wednesday determines the main benchmark for borrowing costs across the economy, including mortgages and beyond. Thursday’s 30-year auction asks the longest question: what rate does it take to get investors comfortable lending for decades?
👉🏼 I built this post as a companion to a 🌈 live Volya guide, so you can explore the gauges behind the story: Treasury rates, inflation expectations, auction clues, curve shape, and spillovers into mortgages and credit.
Volya is still in private alpha. If you’d like to explore the live guide, or share feedback to improve our product, reply to this email with “Volya access” in the subject line or 💌 request an invite here.
🧠 Why Treasury yields are in focus now
Last month, Treasury sold 30-year bonds at a yield above 5% for the first time since 2007. The following week (May 18th), long-term yields pushed even higher, and the 20-year auction cleared at 5.122% with below-average demand.
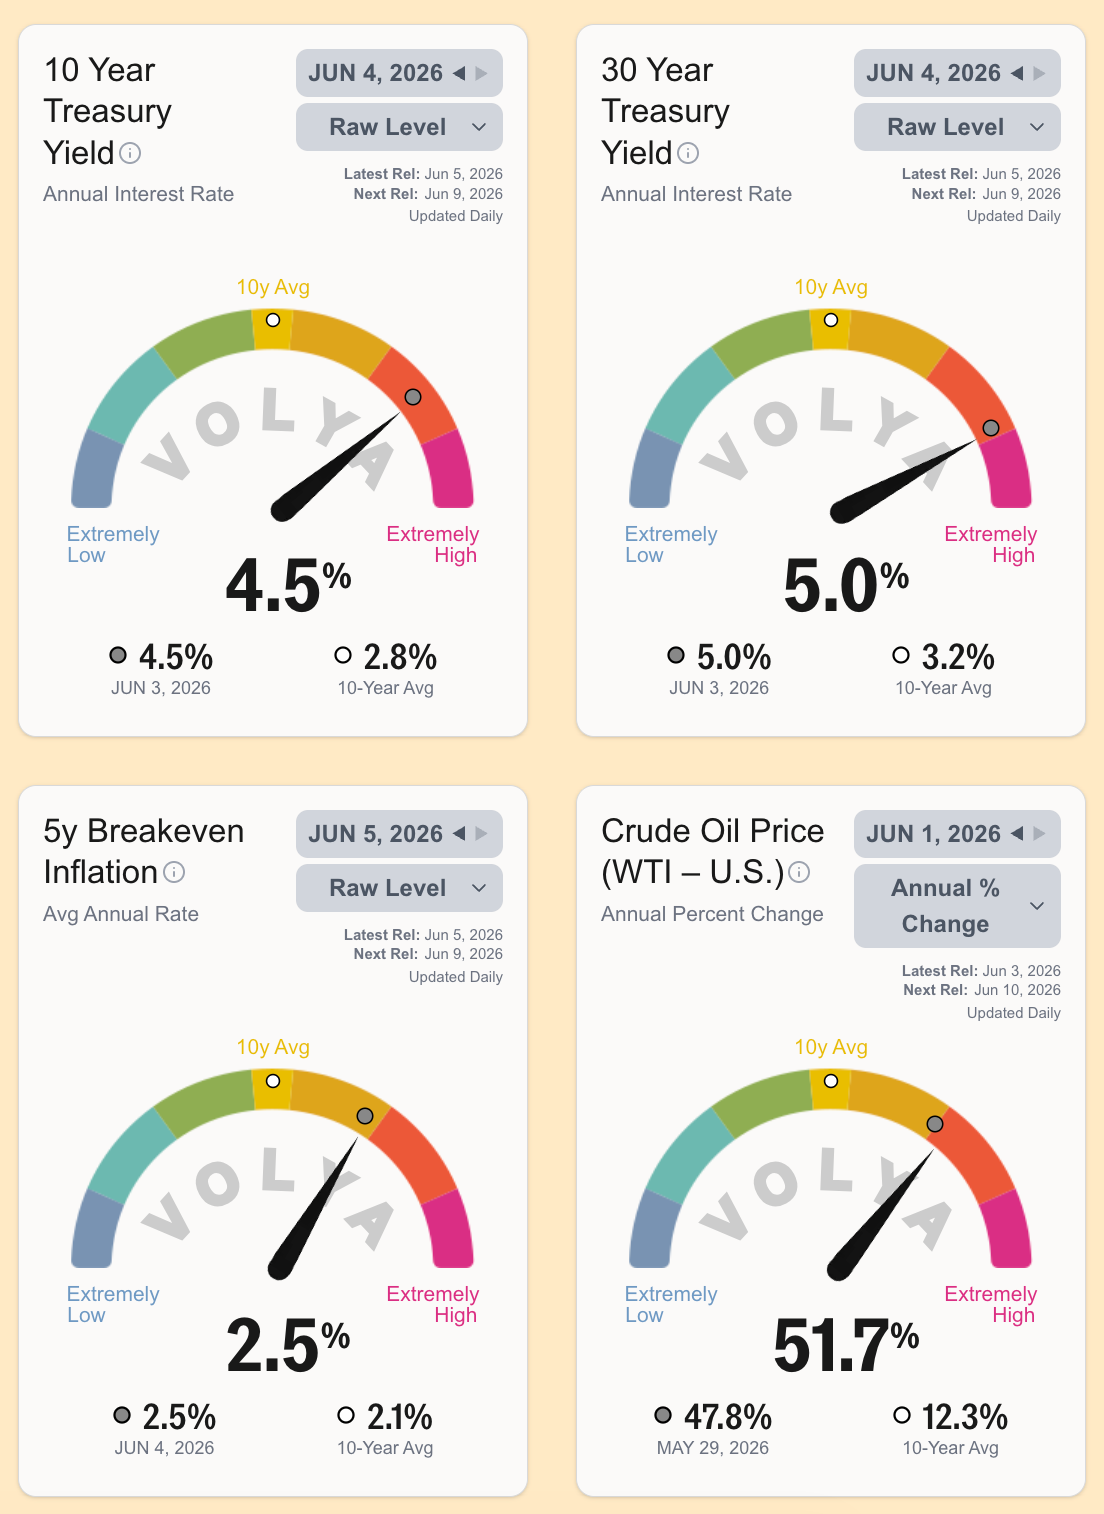
Oil prices and inflation worries due to supply chain disruptions around the world are part of the pressure. If investors think inflation will stay higher for longer and spread through goods and services, the income they expect to earn from lending money will look less valuable in the future, so they may ask for higher yields before lending money for years or decades. The 5-year breakeven inflation rate below gives one market read on those inflation expectations.
Further below, we walk through the market tells: long-term Treasury rates, inflation expectations, and the auction clues that show how eager buyers were when new U.S. government debt came to market. The useful question here is not just whether Treasury rates are elevated, but whether enough demand showed up at current rates. If demand keeps coming in below recent norms, rates may need to shift even higher.
🌈 Show me the rainbow: Volya gauges show how unusual the latest value is relative to the past 10 years. Each rainbow is centered on the 10-year average, with band widths based on that series’ own past-decade distribution: Yellow (Average) is roughly the 45th–55th percentile band around the 10-year average. Green/Orange (Somewhat Low or High) extends through the middle 68%ile band, ie. within a standard deviation for normally distributed series. Teal/Red-Orange (Significantly Low or High) extends through the 97.5% band, ie. within two standard deviations for normally distributed series. Blue/Pink (Extremely Low or High) sits near the outer low/high edge of the past decade’s observed range, i.e. more than two standard deviations away from 10-year average for normally distributed series. High is not always good or bad; it depends on what we’re measuring.
Treasury auctions are a live test of demand for newly issued U.S. government debt. Investors decide how much they want to buy and what yield (ie. interest rate) they need to be paid to buy it. The auction cards below show how much demand appeared when new Treasury debt came to market the weeks of May 11th and 18th.
Experts look at two key auction features:
Yield vs Expected shows whether Treasury had to pay an annual interest rate yield that was higher, the same, or lower than the rate the market was trading at immediately prior to the auction. A tail (ie, positive value) means the auction cleared at a higher yield than the market expected just before the sale — a sign that the amount of debt at the auction (usually billions of dollars) was enough to make buyers demand higher interest rate compensation from Treasury than the current market price that traded immediately before that auction’s start.
Bid-to-Cover measures how much demand there was for the bonds Treasury auctioned — ie, how many times more demand showed up for each dollar of debt sold at auction. When bid-to-cover falls below recent norms, the auction still has buyers, but less extra demand.
❗️ May’s 3-year, 10-year, and 30-year auctions all showed a meaningful tail and lower bid-to-cover than typical. The 30-year yield at auction was and remains elevated, and the latest auction showed investors requiring above-5% yields to absorb new long-term Treasury debt.
Oil relief helped, but did not erase pressure from investors
The week of May 18th added two more auction clues.
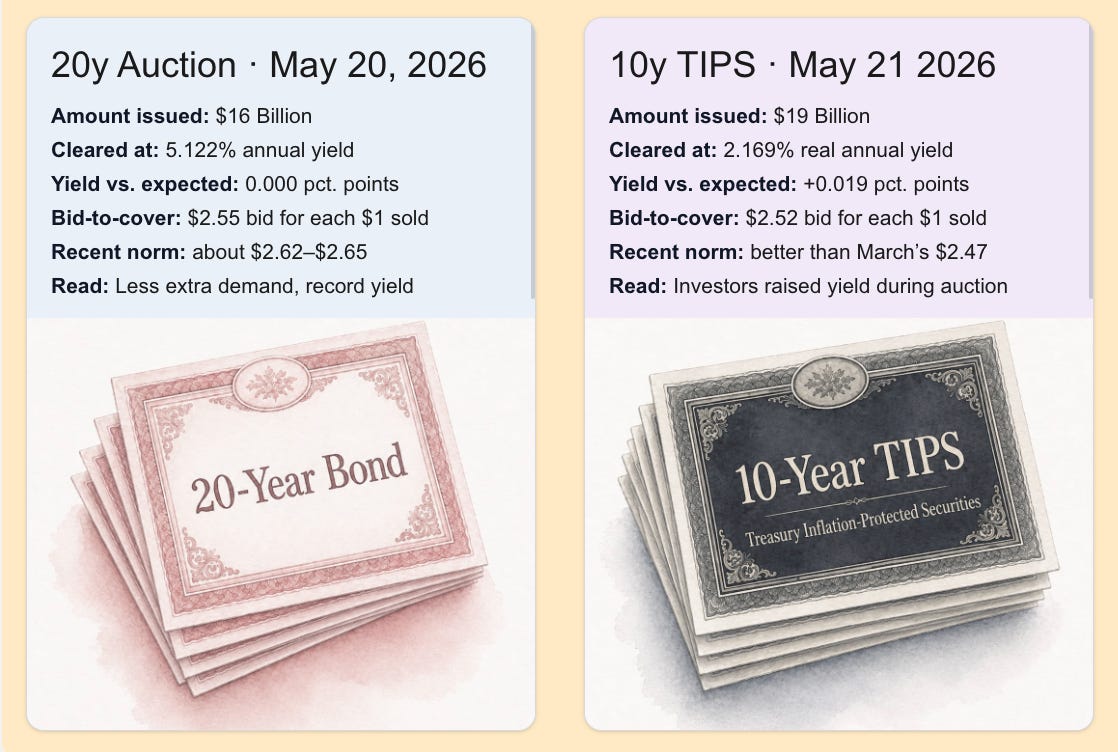
On May 20, Treasury auctioned $16B of 20-year bonds at 5.122% annual yield — the highest yield on a newly auctioned 20-year Treasury ever since the government brought that bond back in 2020, back when I was at the office that ran these auctions. This means investors are demanding elevated interest rates to lend to the U.S. government for the long term. That said, the auction itself was not especially messy. It cleared at the yield traders expected just before the sale, so it did not tail. But bid-to-cover was 2.55, meaning buyers bid $2.55 for each $1 sold, below the recent average of 2.62 across the most recent six 20-year bond auctions. Overall, the auction did not force 20-year yields above what traders expected just before the sale. But the 5.122% annual yield and below-normal bid-to-cover suggest investors are still asking for high interest rates to buy the long-term debt Treasury is issuing.
Oil prices had eased as May 20’s auction happened, with reports of tankers moving through the Strait of Hormuz helping calm some immediate oil-supply fears. Oil prices impact Treasury markets because they are possibly the fastest way inflation worries can travel: if investors think fuel prices are about to jump, future income from lending money looks less valuable, so they may ask for higher yields before lending long-term. A calmer oil backdrop may have helped the 20-year auction clear cleanly.
But that calmer backdrop did not erase the longer-term inflation concern. The 10-year TIPS auction tailed suggesting that even when investors show up for inflation protection, they are still demanding higher real returns to lend more money to Treasury. TIPS are Treasury Inflation-Protected Securities: they compensate investors for inflation, then pay a real yield interest payment on top of that inflation payment. This auction cleared at 2.169% real annual yield, meaning Treasury will pay investors that much each year in addition to compensation for future inflation.
The market had expected about 2.15%. Because the auction cleared above that (ie. a positive tail), it suggests there was less demand at the expected yield than the market had anticipated. Treasury still found buyers, but only after offering a slightly higher real return.
There were $2.52 in bids for each $1 sold, better than the $2.47 in March’s 10-year TIPS auction. That stronger bid volume strengthens the tail signal: it shows investors were interested in inflation-protected debt. But even with that demand, the auction still cleared at a higher real yield than expected.
The market’s breakeven inflation expectation at the auction’s end was also the highest for a similar auction ever since September 2022. That means investors were pricing in more inflation over the coming years, which can make TIPS more attractive. But the auction result still points in the same direction as the rest of the guide: investors are showing up, but the rate required to get them there is moving higher. We’ll have to keep an eye on future auctions to see if investors keep signaling they want to be compensated with higher interest rates.
🌈 Reading The U.S. Treasury Yield Curve
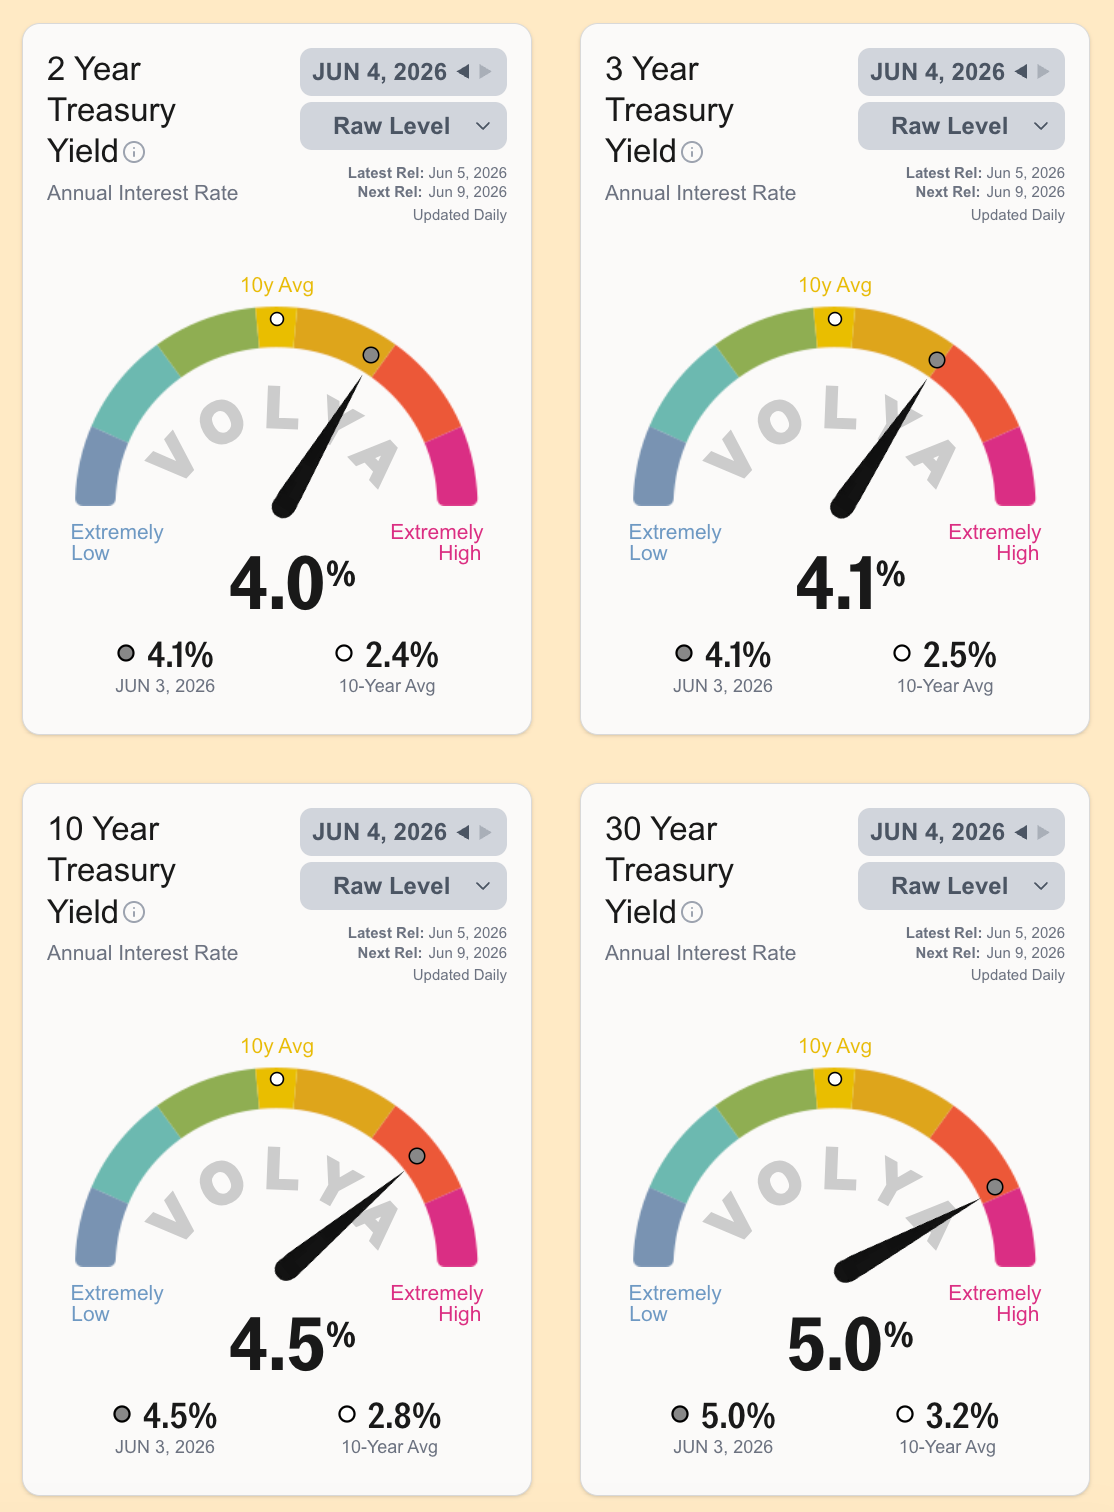
Treasury yields show the interest rate the U.S. government pays to borrow across different time horizons.
The short-term end of the curve, like the 2-year and 3-year region, is closely tied to expectations for Federal Reserve policy. The longer end, like the 10-year and 30-year, reflects a broader mix: expected future rates, inflation, growth, and the extra return investors require to hold bonds for longer.
The 10-year yield is the main long-term benchmark for the economy, with close ties to mortgage rates, corporate borrowing, municipal finance, and asset valuations. The 30-year yield reflects the outlook further out, showing what interest rate investors require to lend for decades and how much compensation they want for long-term uncertainty.
Read together, these tiles help show whether upward interest rate pressure is concentrated near the shorter-term Fed-sensitive part of the curve, in longer-term borrowing costs, or across both.
🌡️ Treasury Yield Curve Shape
Is pressure coming from short rates or long rates?
The yield curve compares short-term and long-term Treasury rates.
When short-term rates are much higher than long-term rates, the curve is called “inverted.” That often reflects tight monetary policy and concern about future growth. When long rates rise relative to short rates, the curve steepens. That can mean investors expect stronger growth, more inflation, heavier Treasury supply, or simply want more compensation to hold long-term bonds.
The curve matters because higher long-term yields can tighten borrowing conditions for households, companies, state and local governments, and federal spending, even without a new Fed hike. The key question is not just whether yields are high. It is: which yields are rising? If long-term yields move up while short rates are stable or falling, the market is repricing as a response to long-term borrowing conditions, not just changes in Fed policy expectations.
🏡 Spillovers Beyond the Treasury Market
The places to watch where higher Treasury yields can spread next.
Treasury yields are not the only borrowing cost in the economy, but they are the starting point for many others.
Mortgage rates, corporate bonds, municipal debt, and project finance all build on top of Treasury yields. If Treasury yields rise, other borrowers can face higher costs even if their own credit risk has not changed. If credit spreads widen too, the pressure becomes stronger.
This is why a relatively weak Treasury auction can matter outside bond markets. The auction itself might not get wide attention. But the spillover has practical effects for many: higher mortgage rates, more expensive refinancing, higher returns needed to fund projects, and less access to cash and higher interest rates for household and corporate borrowers who have been waiting for lower rates in many cases.
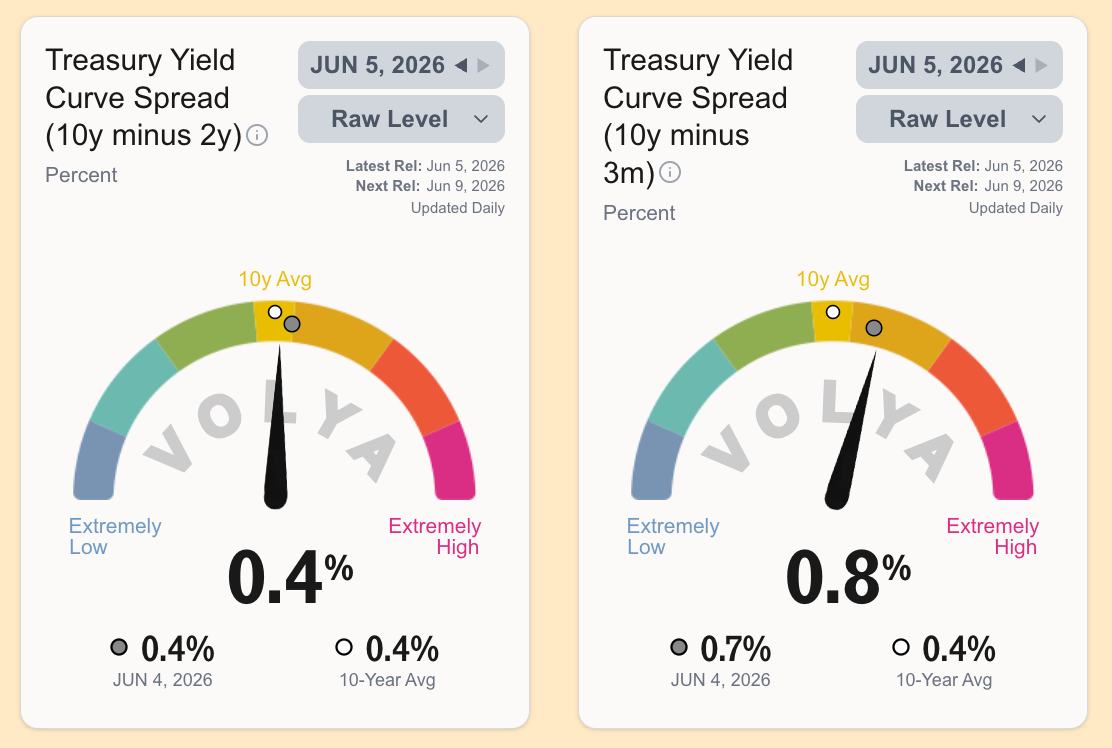
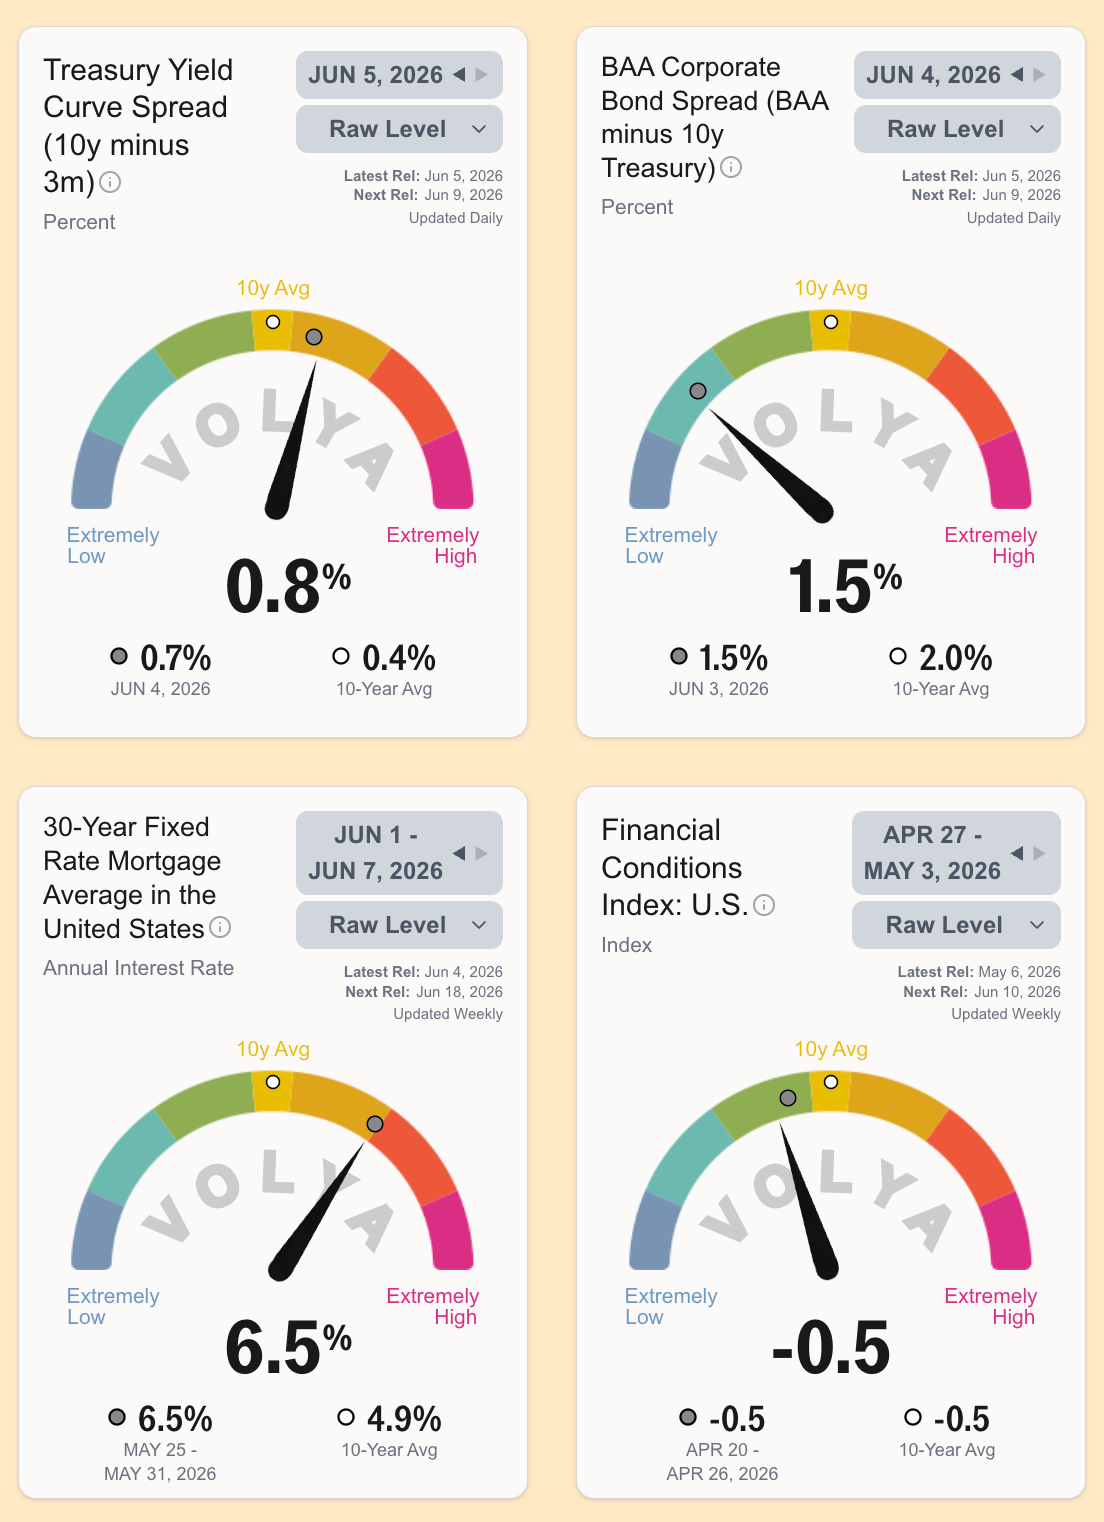
The 10-year Treasury yield is now about 0.8 percentage points above the 3-month Treasury rate, compared with a 10-year average closer to 0.4 percentage points. That suggests long-term borrowing costs are elevated relative to the very short-term rate.
The BAA Corporate bond is just 1.5% above the 10-year Treasury, which is lower than its typical 2.0%. This suggests that corporate bonds haven’t risen as much as the 10-year Treasury has in response to recent events. However, 30-year mortgages are somewhat elevated at 6.5% and have been rising in recent weeks. All that said, the Chicago Fed Financial Conditions Index for the U.S. is still at levels typical of the past decade, signaling that overall the financial system appears fairly normal.
🎈Factors that Could Keep Treasury Yields Elevated: Fed, Inflation & Fiscal Pressure
Treasury yields rise for different reasons, each pointing to a different interpretation.
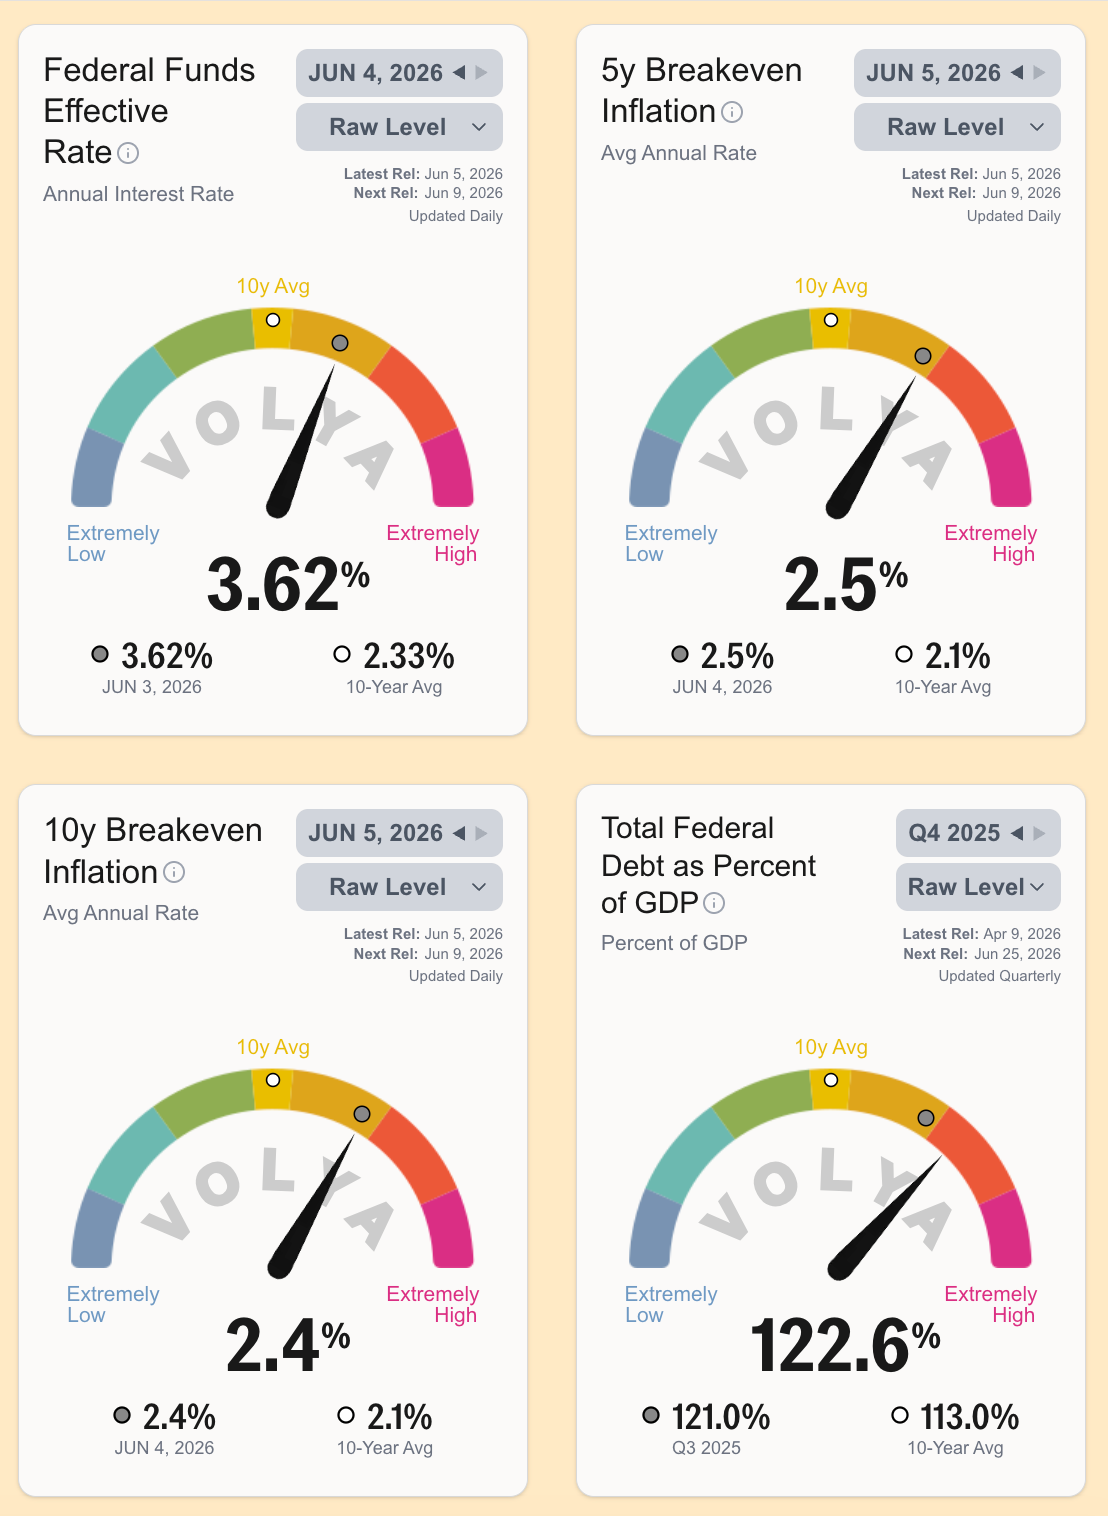
Short-term rates can drive Treasury yields higher. The Federal Funds rate is the Fed’s main short-term interest rate. It shows how much the Fed’s elevated short-term rates are at work here.
Inflation expectations can drive investors to demand higher interest rates, too. 5-year and 10-year Breakeven Inflation shows the market’s average inflation expectation over the next 5 and 10 years.
Federal Debt as a share of GDP shows the fiscal picture for the U.S., specifically how much debt the government is taking on relative to the size of the economy. Experts use this figure to understand how much debt the Treasury is likely to be supplying longer-term. A higher debt burden does not automatically cause weak auctions but it can shape investor concern about how much Treasury supply-to-market needs to absorb over time. The more the Treasury needs to borrow, the higher the rate it may need to pay to convince more investors to park their money there. Investors look to the auction signals (see the 🧾 Auction Signals: How Eager Are Treasury Buyers? section above) to understand if the volume of debt might be running against limited investor appetite.
The main question is whether recent auction softness is temporary — a few rough sales in a busy market — or part of a more persistent repricing of U.S. debt.
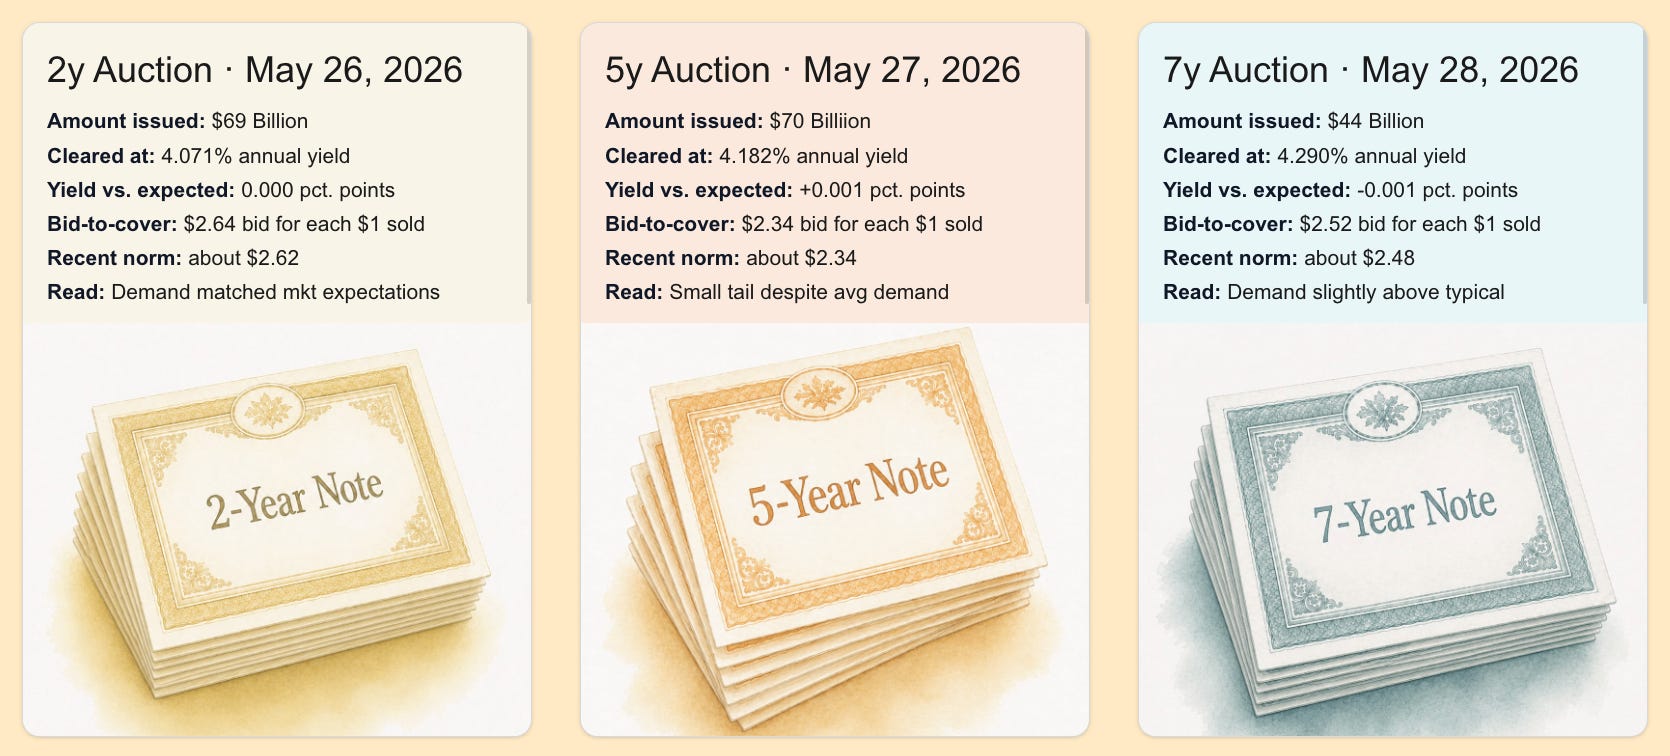
Post-Memorial Day Update: Short-Term & Med-Term Auctions
The post–Memorial Day 2-year, 5-year, and 7-year auctions looked steadier than the earlier long-term auctions. Not surprisingly, buyers showed up at roughly the rates markets expected, and bidding was near or above recent norms. This suggests the pressure has not spread across all Treasury durations of borrowing. Buyers are willing to lend to the U.S. government at shorter and middle time horizons without asking for higher interest payments.
But the earlier pressure from long-term auctions and Treasury Inflation Protected Securities (TIPS) are still important and loom over this week’s June long-term auctions because they represent the kinds of Treasury securities where investor pushback is expected to start first. Long-term Treasuries and TIPS ask investors to take on more uncertainty: decades of interest-rate risk, inflation risk, and, for TIPS, a less-liquid market. When those auctions require higher yields or show thinner extra demand, experts pay attention because those are often the auctions where buyers become more price-sensitive first.
Tell me: I’d love to hear what borrowing-cost tea leaves you’re watching in your own world right now. Are mortgage rates, refinancing, city budgets, business loans, hiring plans, infrastructure projects, or the AI question affecting decisions around you? Let us know in the comments!
Want to explore the 🌈 live gauges behind this guide? Volya is still in private alpha, but we’re opening access to more users and prioritizing our substack readers. Reply to this email with “Volya access” or 💌 request an invite here.
📼 🎶 Every post on Volala comes with its own soundtrack because music reminds us we’re not navigating these times or markets alone.
When we talk about rates and auctions like market plumbing, we’re really talking about what kinds of companies, projects and world borrowing and investment are shaping.
Let’s close this one out with “Where Do the Children Play?” from Cat Stevens’ Tea for the Tillerman — for the builders, gardeners, borrowers, planners, and community-tenders at the tiller,s steering through uncertain waters while keeping an eye on the weather ahead.